Table of contents
Have you ever struggled to find the data you need within platforms like Google Analytics and Google Ads? Or wondered how to present them in a simple and intuitive way to your clients?
If the answer is yes, you can stop worrying: Looker Studio by Google is a powerful solution that will significantly streamline your work. Let’s see how.
What is Looker Studio?
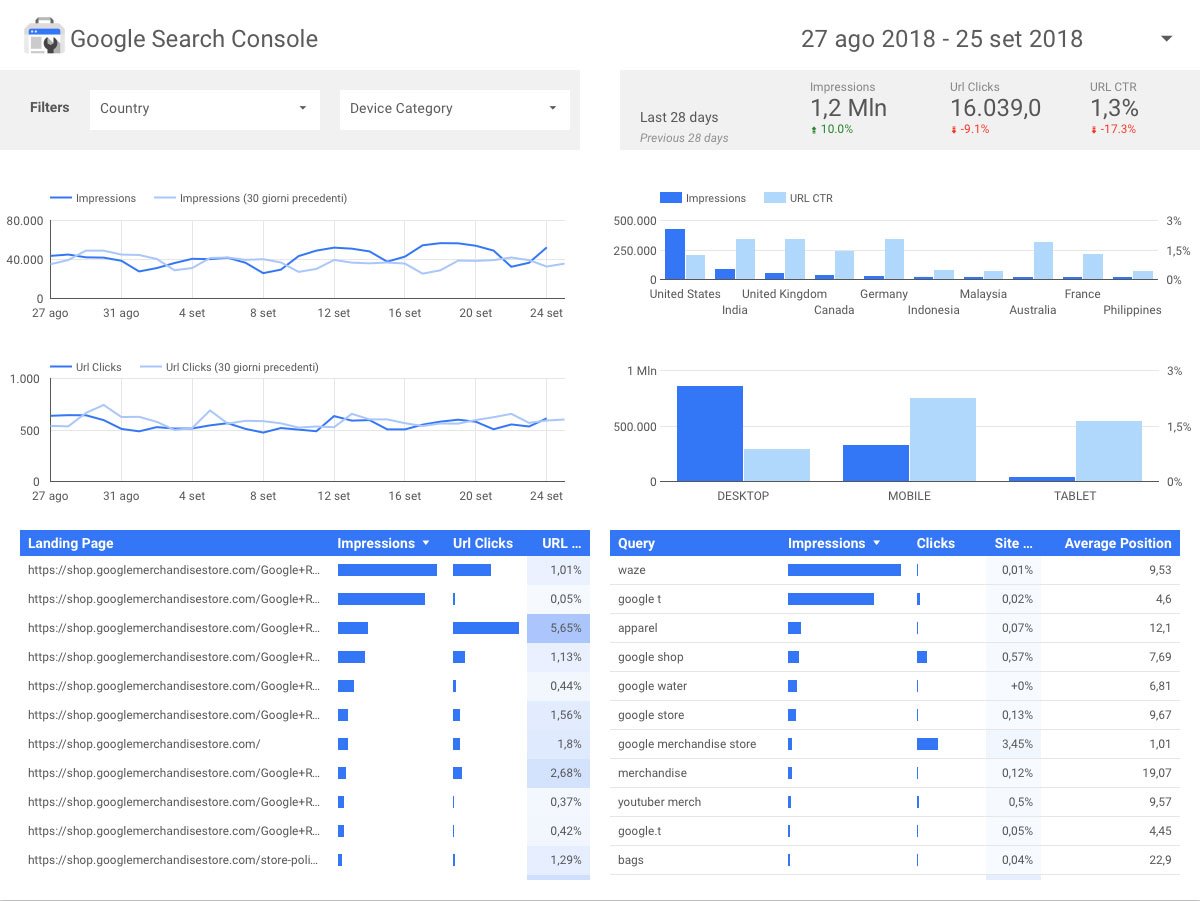
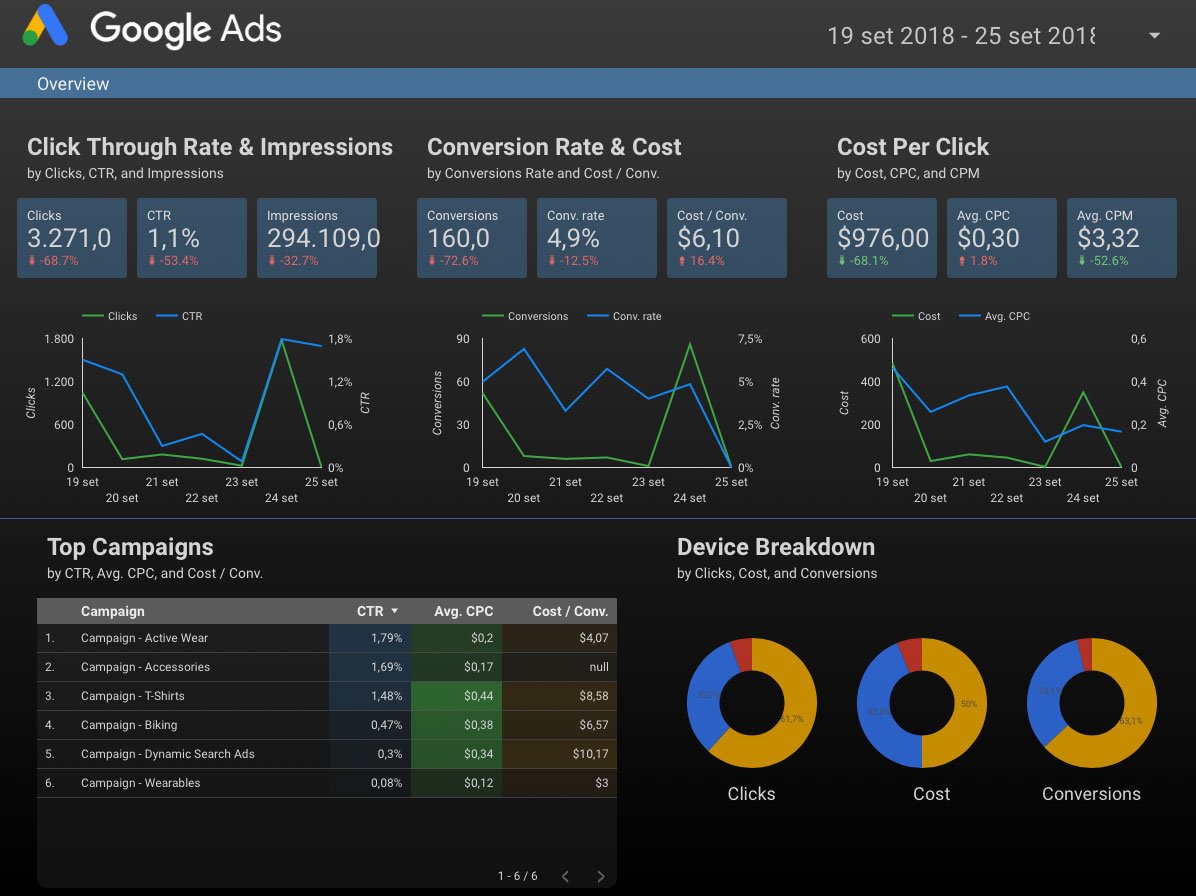
Formerly known as Google Data Studio, Looker Studio is a valuable free Data Visualization tool. Connecting to various data sources like Google Analytics, Google Ads, or Google Search Console, this tool allows you to import and use their data to create fully customized, dynamic, and interactive reports.
You can choose the data representation mode that best suits your needs (e.g. tables, pie charts, histograms, line graphs, etc.) and insert images and text with customizable fonts and colors.
Furthermore, you can share the created reports with other users, just like any Google Drive document.
Why use Looker Studio / Google Data Studio?
1. A single place for all your data
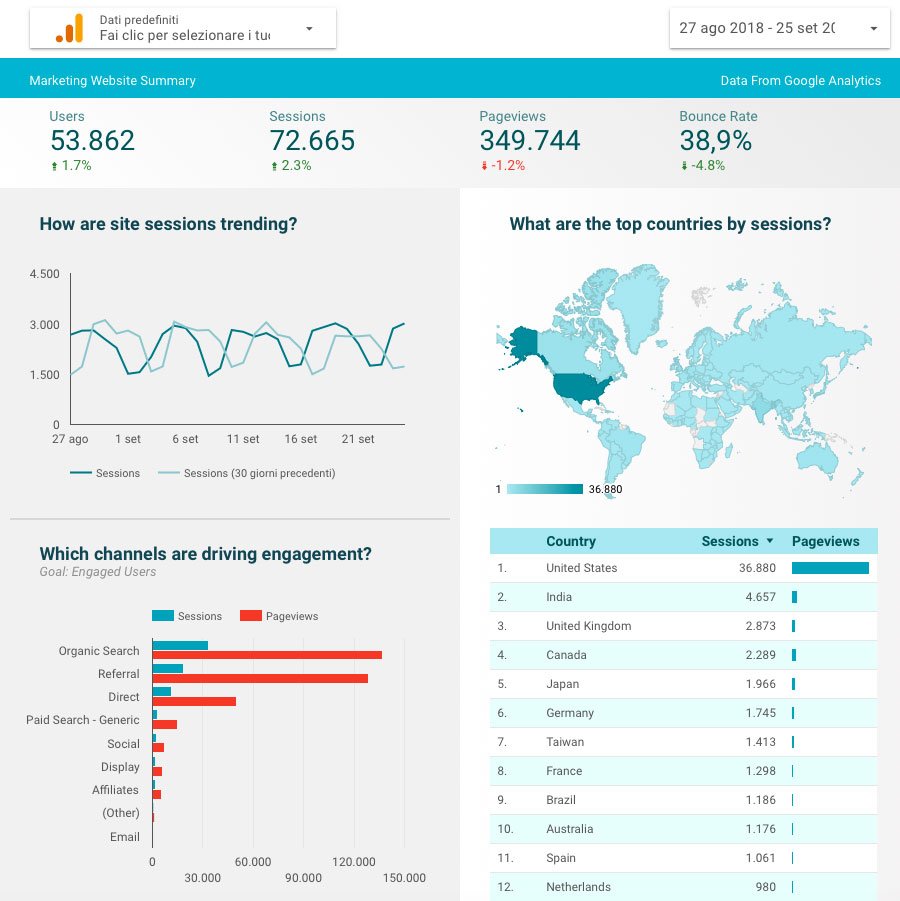
One compelling reason to use Looker Studio? The ability to gather and compare data from multiple platforms in one place.
For instance, by integrating the tool with Google Ads and Google Analytics, you can simultaneously review data related to your campaign performance and the behavior of users who clicked on the ads and visited your landing page.
2. Easily understandable data
Presenting a vast amount of data, tools like Google Analytics can sometimes make it challenging to quickly retrieve the information we need. With Looker Studio, you can set up a report that immediately presents all the necessary data and displays it in your preferred visualization style.
3. Dynamic and interactive reports
In addition to fixed-time interval reports, Looker Studio allows you to create dynamic reports that automatically update based on the selected period (e.g., “last 7 days,” “last 30 days,” etc.).
You can also generate interactive reports where users can modify the reference period through a date selector: by changing the time range, all chart and table data will be automatically updated. This way, you only need to set up the report once instead of generating a new document periodically.
4. Sharing with clients and collaborators
Similar to Google Drive, Looker Studio enables you to share documents with other users, facilitating group collaboration on report creation and direct sharing with clients.
5. Ready-made templates
While allowing maximum report customization, Looker Studio also offers a range of ready-made templates for use. Some of these templates are tailored to various data sources (e.g., Google Ads, Google Search Console).
Ready to create effective and engaging reports?
Refer to the guide provided by Google to start using Looker Studio and analyze the results of your web marketing activities. If you require the support of a Web Analytics specialist, feel free to reach out to our agency.
Table of contents